
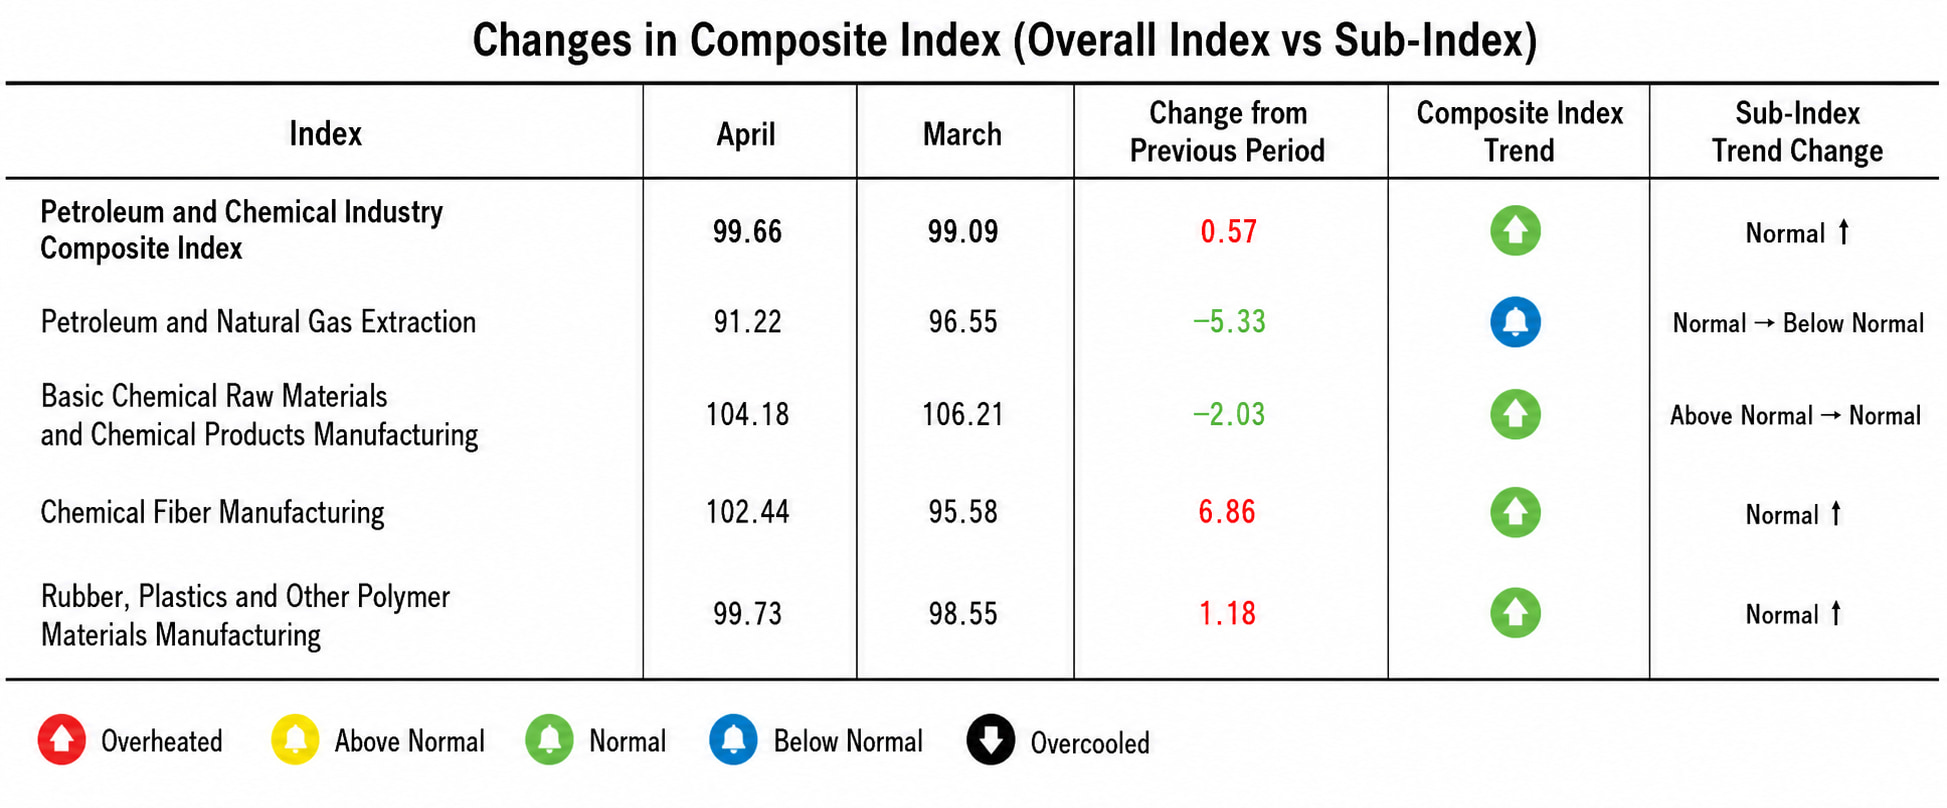
Ya están disponibles los datos de abril de 2026. El Índice de Prosperidad de la Industria Petrolera y Química subió ligeramente 0,57 puntos porcentuales con respecto al mes anterior, situándose en 99,66. Si bien el índice general sugiere estabilidad, un análisis más detallado revela un panorama muy fragmentado.
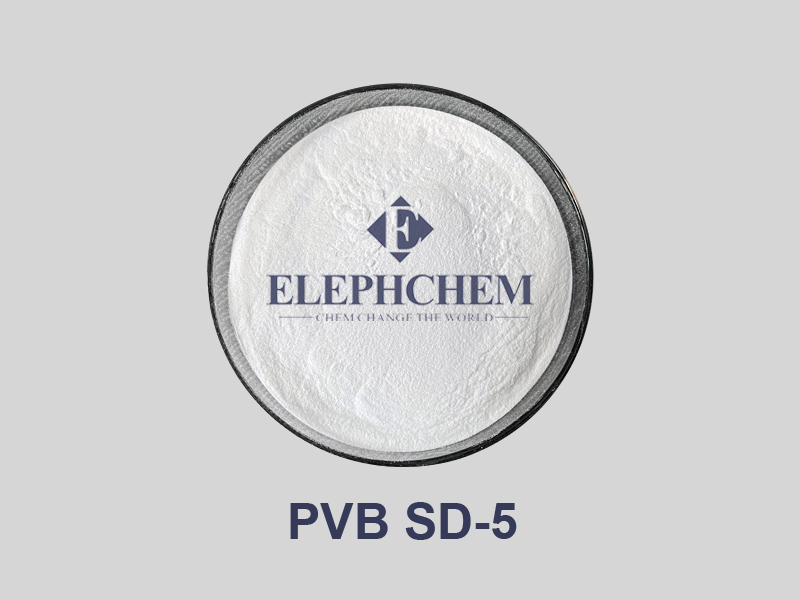
La industria está atravesando actualmente un período de ajuste estructural impulsado por los elevados precios sostenidos del crudo. El patrón tradicional de "subida y bajada simultáneas" ha cambiado. En cambio, estamos viendo un mercado altamente diferenciado dictado por la eficiencia en la transmisión de costos, el poder de fijación de precios y la estrategia de inventarios: los sectores upstream se están contrayendo, los actores midstream prosperan gracias a una transmisión fluida de costos y downstream (polivinil butiral)) los segmentos están reduciendo drásticamente sus existencias.
1. Panorama general de la industria petrolera y química
El índice general de 99,66 oculta las realidades radicalmente diferentes a lo largo de la cadena de suministro:
📉 Exploración y producción: Recortes estratégicos de producción
Índice de extracción de petróleo y gas: descendió 5,33 puntos porcentuales hasta 91,22.
Índice de Procesamiento de Combustibles: Cayó 2,03 puntos porcentuales hasta 104,18.
Con el crudo internacional rondando cómodamente los 90 USD/barril, los márgenes de beneficio en la fase de exploración y producción mejoraron técnicamente. Sin embargo, los mercados de consumo final están reaccionando ante estos altos precios. Para contrarrestar la débil demanda en las terminales, las empresas extractoras de petróleo y gas adoptaron una estrategia de "control del volumen para proteger el precio". Del mismo modo, ante el aumento de las existencias de petróleo refinado, las refinerías redujeron sus tasas de operación, pasando de centrarse en la búsqueda de beneficios a precios elevados a la mitigación de riesgos.
📈 Productos químicos intermedios: El punto óptimo
Índice de materias primas químicas y manufactura: aumentó 6,86 puntos porcentuales hasta 102,44.
Los fabricantes de productos químicos intermedios se consolidaron como los grandes ganadores de abril. Tras agotar sus reservas de materias primas más baratas, estas empresas lograron aumentar los precios de sus productos al tiempo que reducían sus inventarios más antiguos. Gracias a un mecanismo de transmisión de precios relativamente fluido, sus márgenes de beneficio se ampliaron significativamente, lo que impulsó una fuerte recuperación del índice.
⚖️ Polímeros posteriores: Una recuperación muy reñida
GomaÍndice de plásticos y polímeros sintéticos: Subió 1,18 puntos porcentuales hasta 99,73.
Situado al final de la cadena de valor, este segmento se enfrenta a una competencia feroz y a una fuerte resistencia por parte de los distribuidores a las subidas de precios. Al no poder repercutir los elevados costes de las materias primas, los márgenes de beneficio se mantuvieron muy reducidos. La leve recuperación de este índice se debió casi exclusivamente a que las empresas redujeron drásticamente sus existencias ("volumen sobre margen") para mantener el flujo de caja.
2. La perspectiva macro: Reversiones del PPI y señales del PMI
Para comprender el desempeño de abril, debemos remontarnos a los datos macroeconómicos de marzo:
Reversión del IPP: El IPP de marzo rompió un ciclo deflacionario de 41 meses, registrando un crecimiento positivo del +0,5% interanual (+1,0% mensual). Esto se debió principalmente al repunte del IPP del sector de extracción de petróleo y gas, que alcanzó el +5,2%.
Divergencia del IPC: Mientras tanto, el IPC de marzo se desaceleró a +1,0% interanual (IPC subyacente en +1,1%).
Esta divergencia —el vertiginoso aumento de los precios de las materias primas en las fábricas frente a la moderación de los precios al consumidor— explica el cuello de botella exacto que vimos en abril. El enorme impacto en los costos derivado del repunte del crudo en marzo tardó entre dos y cuatro semanas en afectar a las fábricas en abril, dejando a los actores de la cadena de valor atrapados entre los altos costos de producción y el débil poder adquisitivo de los consumidores.
Además, el PMI manufacturero de abril se situó en el 50,3%. Si bien supone un descenso del 0,1% con respecto a marzo, marca el segundo mes consecutivo en territorio de expansión, lo que confirma que, aunque la demanda agregada se mantiene estable, persiste la fricción estructural entre los elevados costes de las materias primas y la débil demanda final.
3. Vientos en contra geopolíticos y volatilidad del precio del petróleo
La geopolítica en Oriente Medio siguió siendo el principal factor determinante de los precios del crudo durante todo abril. Tras un breve retroceso a principios de mes, los precios volvieron a dispararse. En la semana del 26 de abril, los promedios semanales del Brent y el WTI aumentaron un 10,65 % y un 9,73 % respectivamente, el segundo mayor incremento semanal desde el inicio del conflicto.
El 29 de abril, el crudo WTI cerró a 106,88 USD/barril, mientras que el Brent cerró a 118,03 USD/barril. Estos precios elevados han incrementado de forma permanente el coste de referencia para toda la industria química.
4. Perspectivas para la industria del petróleo y la química
Al comenzar mayo, el sector se enfrenta a una fase de transición:
El factor petróleo: La geopolítica seguirá marcando la pauta. Si las tensiones persisten, el precio del petróleo se mantendrá por encima de los 90 USD/barril, lo que prolongará la presión sobre los márgenes de los distribuidores. Si la situación se calma, una bajada de precios redistribuirá los beneficios de forma más equitativa a lo largo de la cadena de valor.
El factor de la demanda: Mayo marca el final de la temporada alta tradicional para los productos químicos. Se espera que la demanda de los sectores inmobiliario, textil y de electrodomésticos experimente una desaceleración estacional, lo que significa que los compradores finales probablemente reducirán su ritmo de compra tras el reabastecimiento de abril.
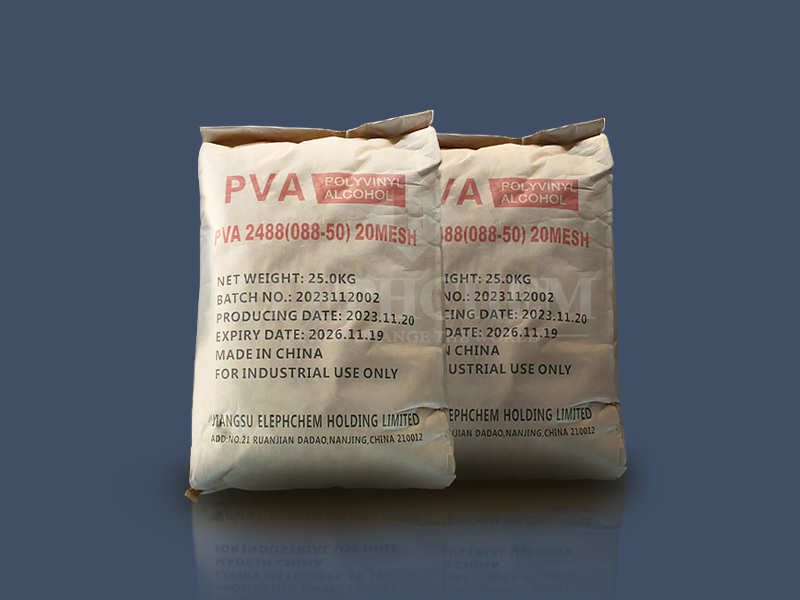
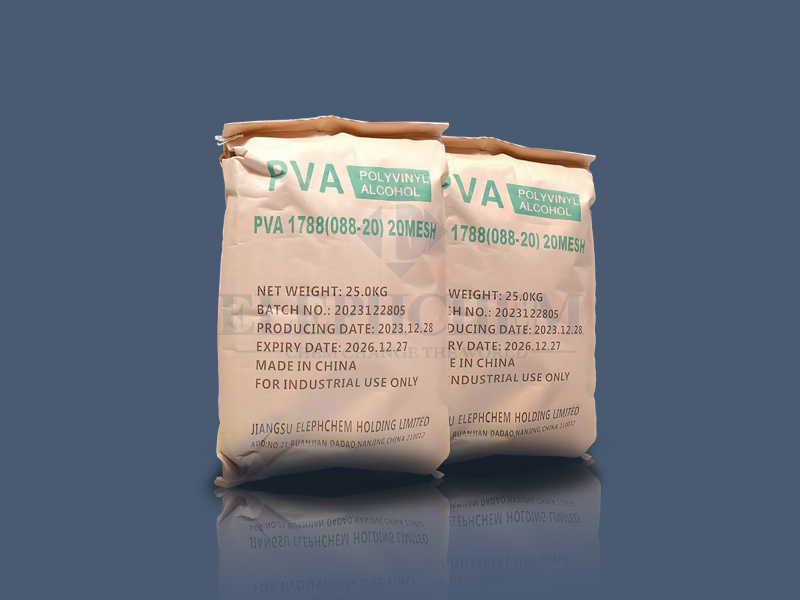
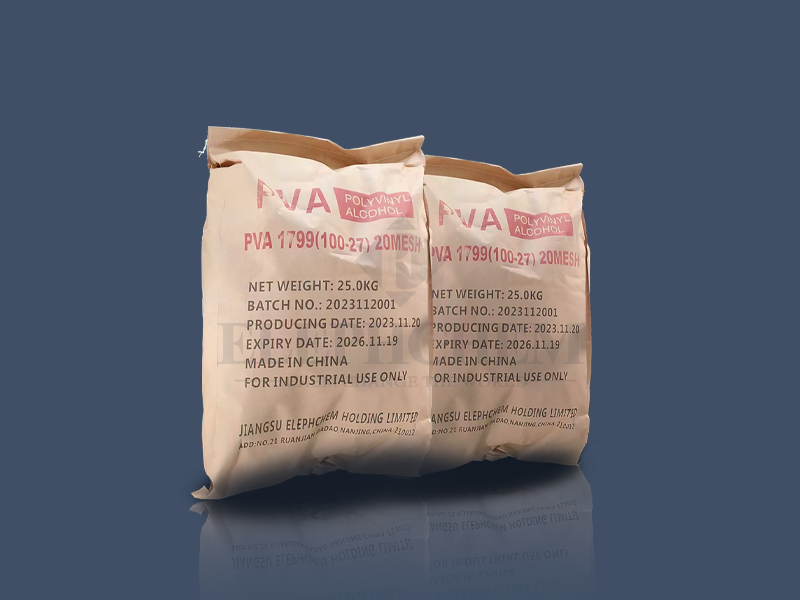
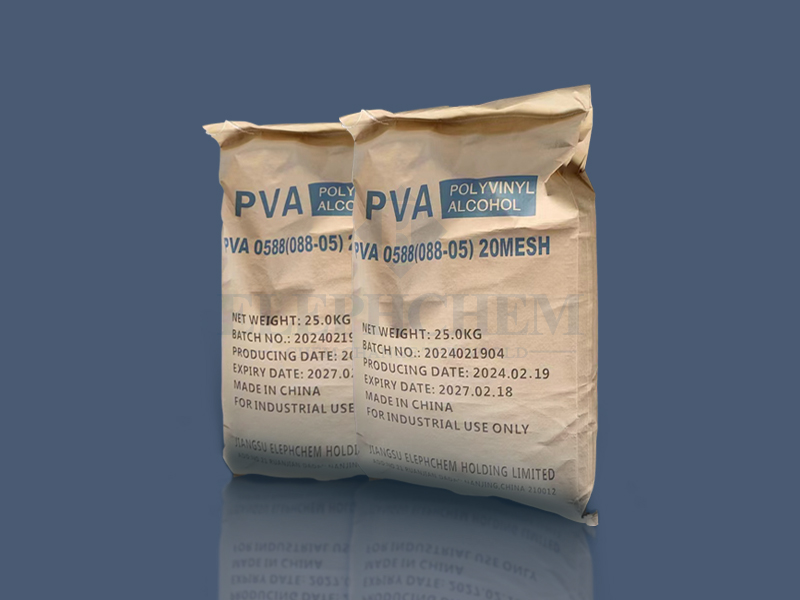
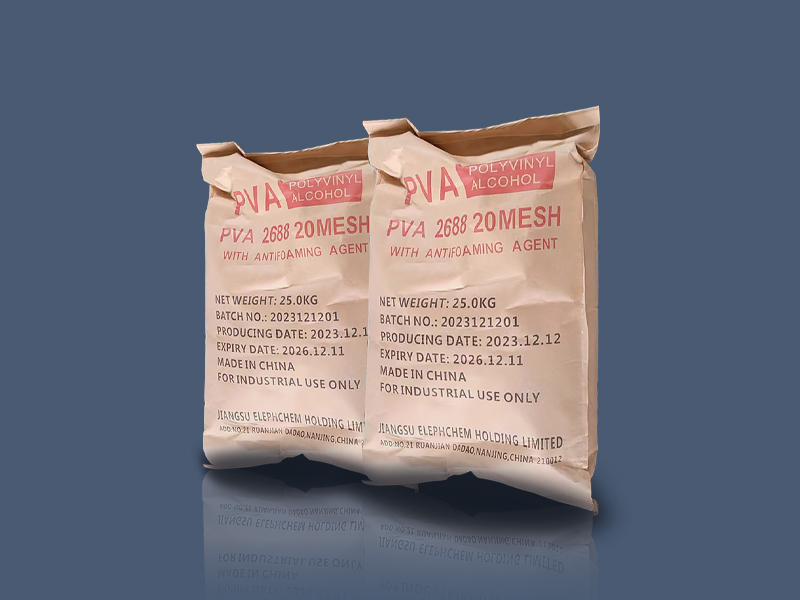
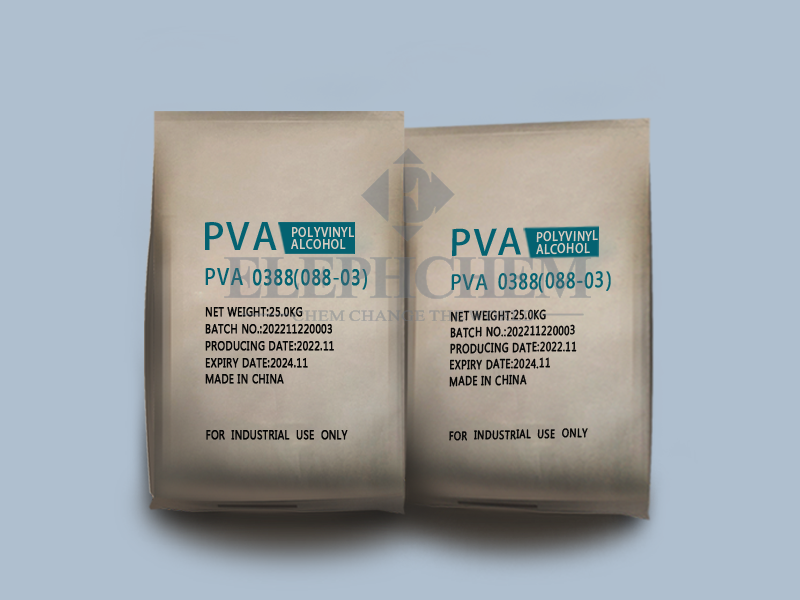
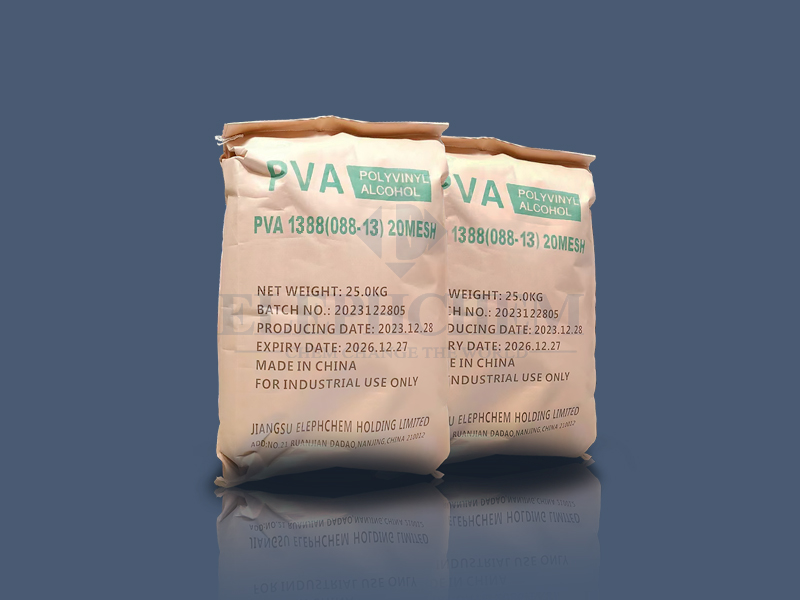
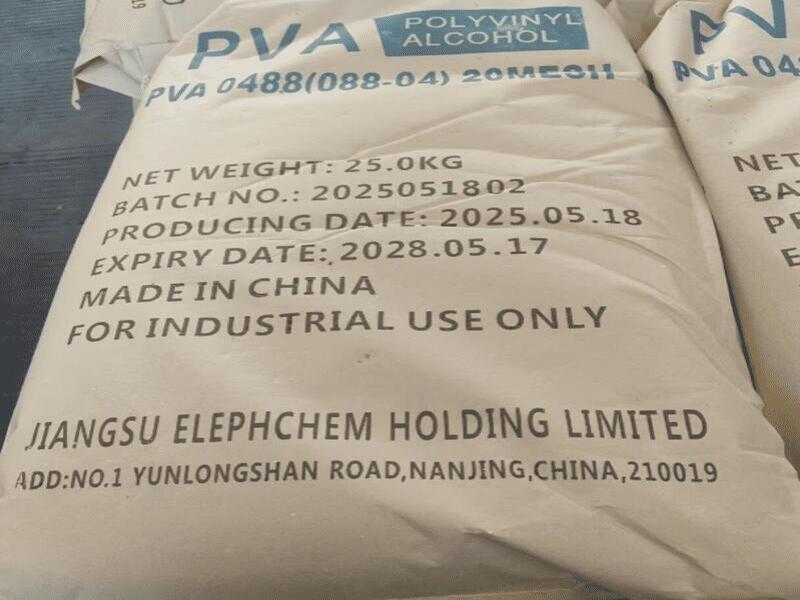
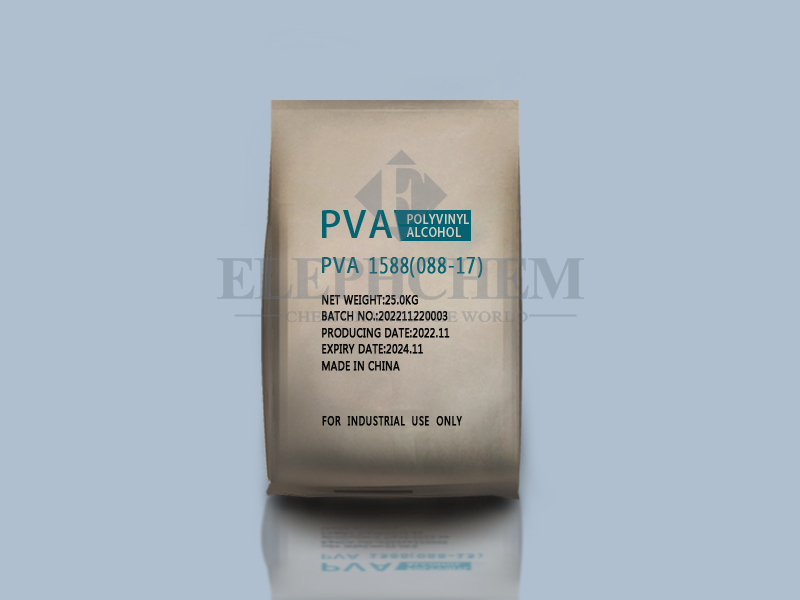
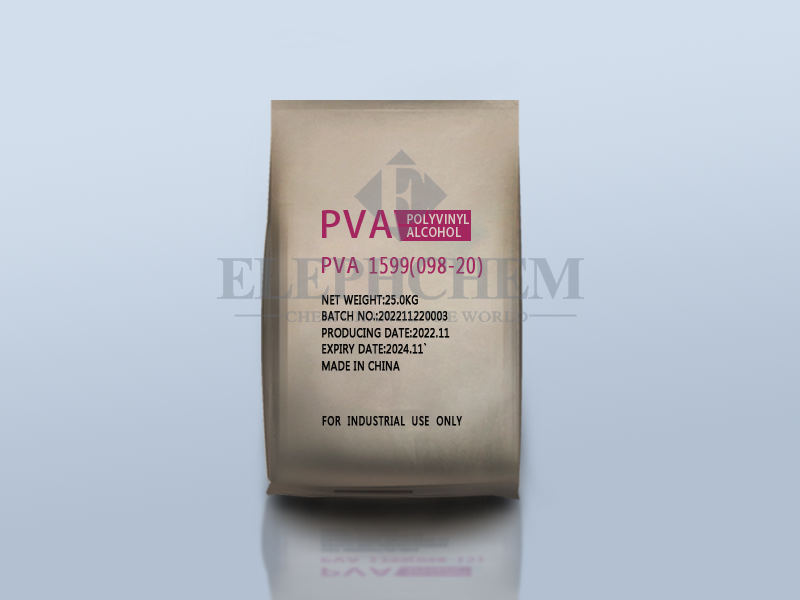
En resumen: Anticipamos que el Índice de Prosperidad podría experimentar una leve contracción en mayo, aunque el riesgo a la baja sigue siendo limitado. Es probable que los sectores de exploración y producción y refinación mantengan una producción ajustada, el crecimiento de los productos químicos intermedios se pondrá a prueba por la desaceleración de la demanda, y los polímeros posteriores (como Alcohol polivinílico)Los fabricantes tendrán que demostrar si su estrategia de "alta facturación y bajo margen" es sostenible.
Sitio web: www.elephchem.com
WhatsApp: (+)86 13851435272
Correo electrónico: admin@elephchem.com




 Soporta red IPv6